Loading Case Study Experience...
Private Staging & Codebase
UI/UX Design & Product Development2025AgriTech Command CenterPredictive AnalyticsMulti-Farm ManagementSupervisor AuditIoT Thermal HeatmapsRoss 308 Traceability
Project CGF
Intelligent, data-driven multi-farm predictive management dashboard transforming raw livestock telemetry into actionable operational intelligence, supervisor compliance tracking, and cross-farm benchmarking for executive leadership.
My Primary RoleLead Product UX Architect & Enterprise Dashboard Specialist
Domain & SectorUI/UX Design & Product Development
Timeline / Release2025 · Production
Evaluation Access
Live PrototypeOpen Interactive Prototype
⚡
Live Interactive Figma Prototype Available
Experience the live interface flows, micro-interactions, responsive states, and product design system in action.
01 · Strategic Overview & Problem
The Challenge & Design Objective
The Core Friction
The business operates multiple farm sites and lacked a centralized system to monitor and compare performance across locations. Supervisors updated disconnected databases and paper records, making a holistic, real-time operational view impossible. Critical environmental hazards (such as ammonia spikes or rapid temperature shifts) were detected too late, leading to increased mortality, sub-optimal Feed Conversion Ratios (FCR), and lost enterprise profitability.
The UX/UI Solution
Designed and delivered Project CGF, a unified multi-tier dashboard featuring: (1) Executive Overview with global KPI cards and interactive flock health matrix; (2) Line Supervisor Management module with timestamped visit verification; (3) Granular Flock Drill-Down with growth curves and dual-axis FCR analysis; (4) Real-time 10×10 environmental sensor heatmaps; (5) Forecasting Hub with what-if market price/feed cost simulators; (6) Health Risk alerting powered by acoustic and behavioral anomaly detection; and (7) Ross 308 end-to-end supply chain traceability.
My Design & Architectural Responsibilities
Lead UX & Product Architect: Defined the information architecture, navigation hierarchy, and user roles across executive leadership, supervisors, and veterinarians.
Telemetry & Heatmap Specialist: Designed 10×10 spatial matrix visualizers for barn microclimate thermal sensors and automated rate-of-change alert cards.
Predictive Modeling Designer: Crafted the dynamic What-If profitability simulator coupling live market grain/poultry prices with flock feed intake curves.
02 · Target Audience & Empathy Mapping
User Persona & Behavioral Flow
Marcus Vance
Chief Operating Officer & Director of Farming Operations, CGF
“Managing multiple grower farms without unified visibility was like flying blind. CGF gives me instant cross-farm benchmarking, alerts me to flock health anomalies hours before they escalate, and proves our supervisors are in the field when they say they are.”
Critical Pain Points & Friction
- Disconnected databases across farm locations preventing real-time cross-site benchmarking
- Lack of accountability for line supervisors field visit frequency and biosecurity adherence
- Lagging indicators for flock mortality and feed conversion ratio (FCR) with no what-if cost projections
Core Goals & Desired Experience
- View global enterprise KPIs with instant one-click drill-down into specific houses and flocks
- Monitor verified supervisor visit logs and ensure biosecurity compliance schedules
- Simulate harvest profitability against real-time grain costs and market poultry prices
End-to-End User Journey Mapping
Phase 1 · Multi-Farm Morning Audit & KPI TriageAnalytical & Focused
COO opens Leadership Overview, toggles farm filter to compare North Farm vs West Farm, and investigates House 1 (Flock H1-F102) flagged as At Risk.
Friction: Having to wait for end-of-week spreadsheets to spot underperforming flocks.
UX Solution: Color-coded Flock Health Matrix with instant sorting by FCR, mortality rate, and projected profit.
Phase 2 · Field Supervisor Verification & ComplianceAuthoritative & Reassured
Operations Director navigates to Supervisor Management, searches for assigned supervisor, and audits recent on-site farm visit timestamps.
Friction: Disputes over whether biosecurity inspections were physically conducted prior to health alerts.
UX Solution: Timestamped visit ledger with weekly/monthly frequency indicators and assigned facility tags.
Phase 3 · Sensor Heatmap & Microclimate InvestigationUrgent & Decisive
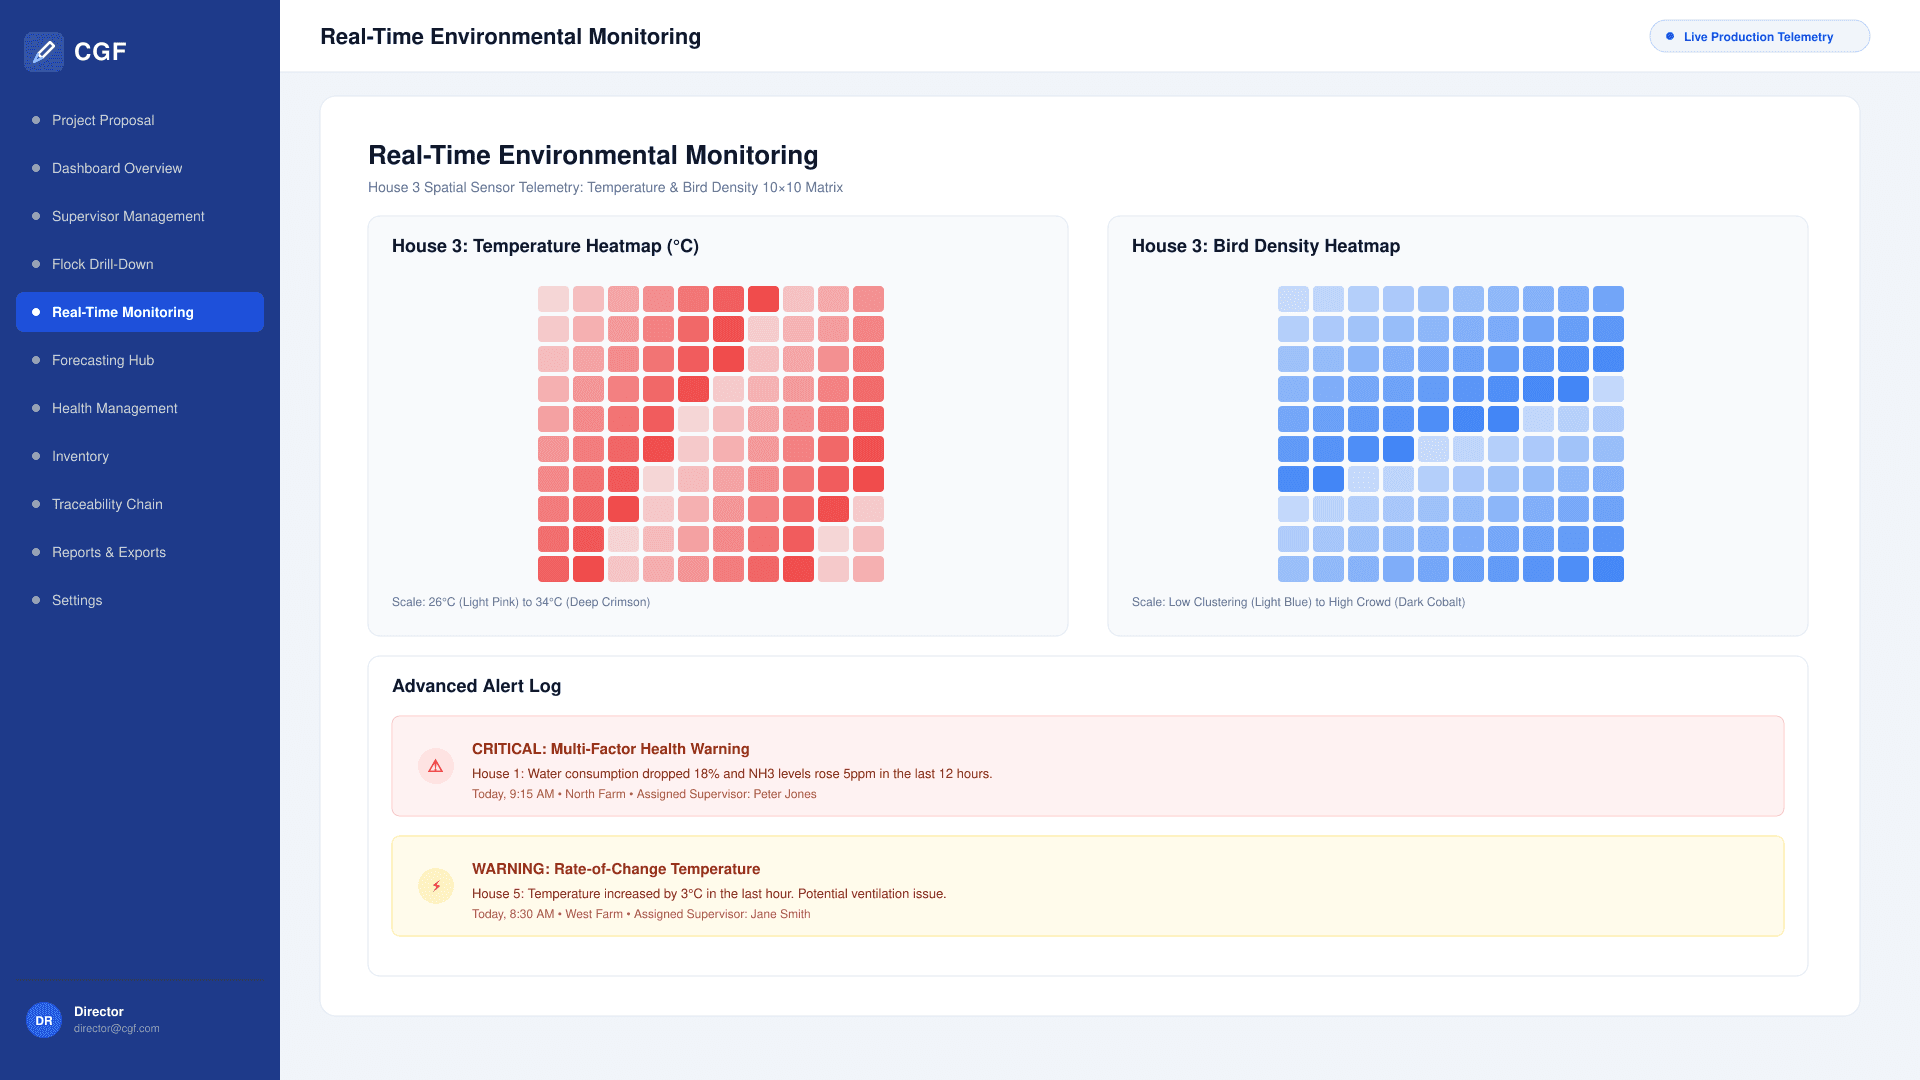
Farm Manager drills into House 3 monitoring, inspecting 10×10 thermal grid and multi-factor alert showing an 18% drop in water consumption with ammonia rising 5ppm.
Friction: Static single-point thermometer dials failing to detect localized ventilation dead spots.
UX Solution: High-density spatial heatmap revealing thermal gradients and bird crowding anomalies.
Phase 4 · What-If Profitability & Harvest ForecastingConfident & Empowered
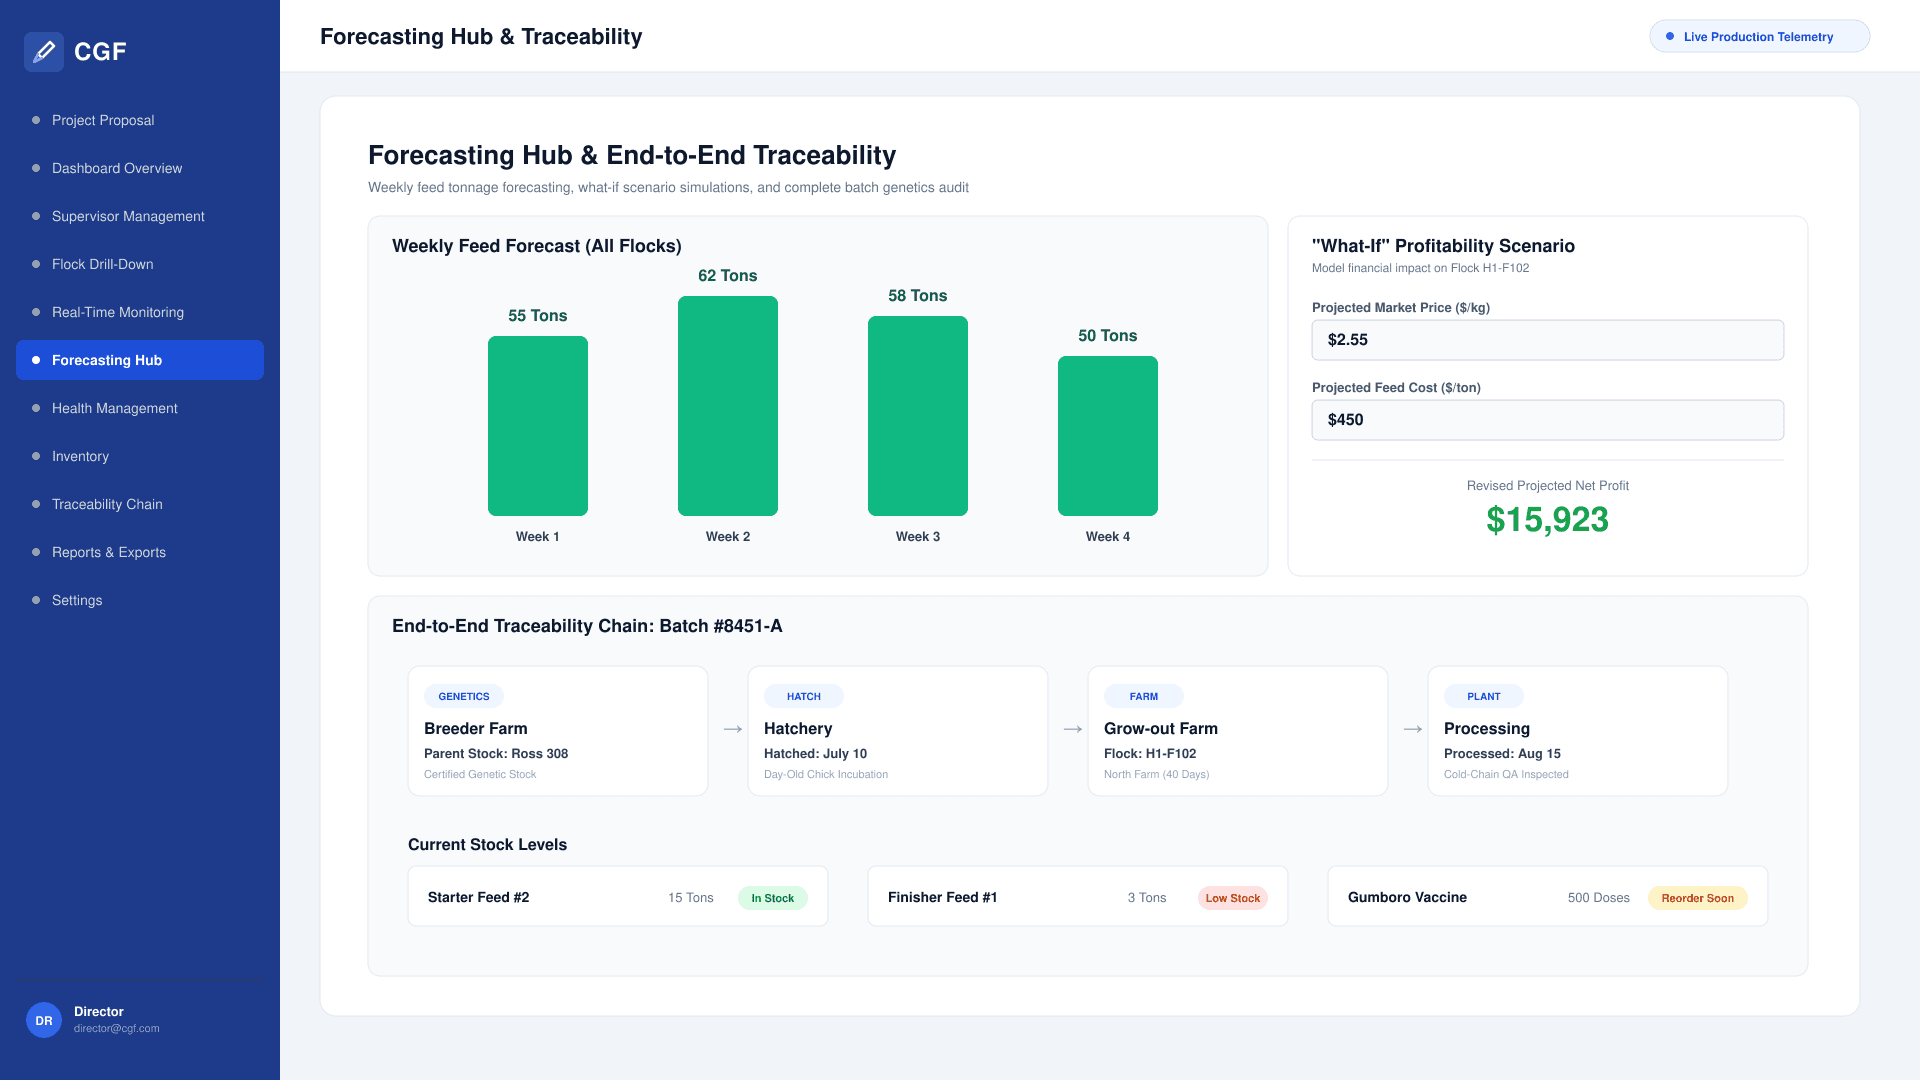
Financial Analyst opens Forecasting Hub, adjusts expected market price to $2.55/kg and feed cost to $450/ton, immediately visualizing revised enterprise net margins.
Friction: Complex offline spreadsheet recalculations prone to formula errors.
UX Solution: Interactive dual-input slider engine recalculating revised flock net profit with instantaneous visual feedback.
03 · Structural UX Architecture
Information Architecture & Wireframes
Leadership Command & Global KPIs
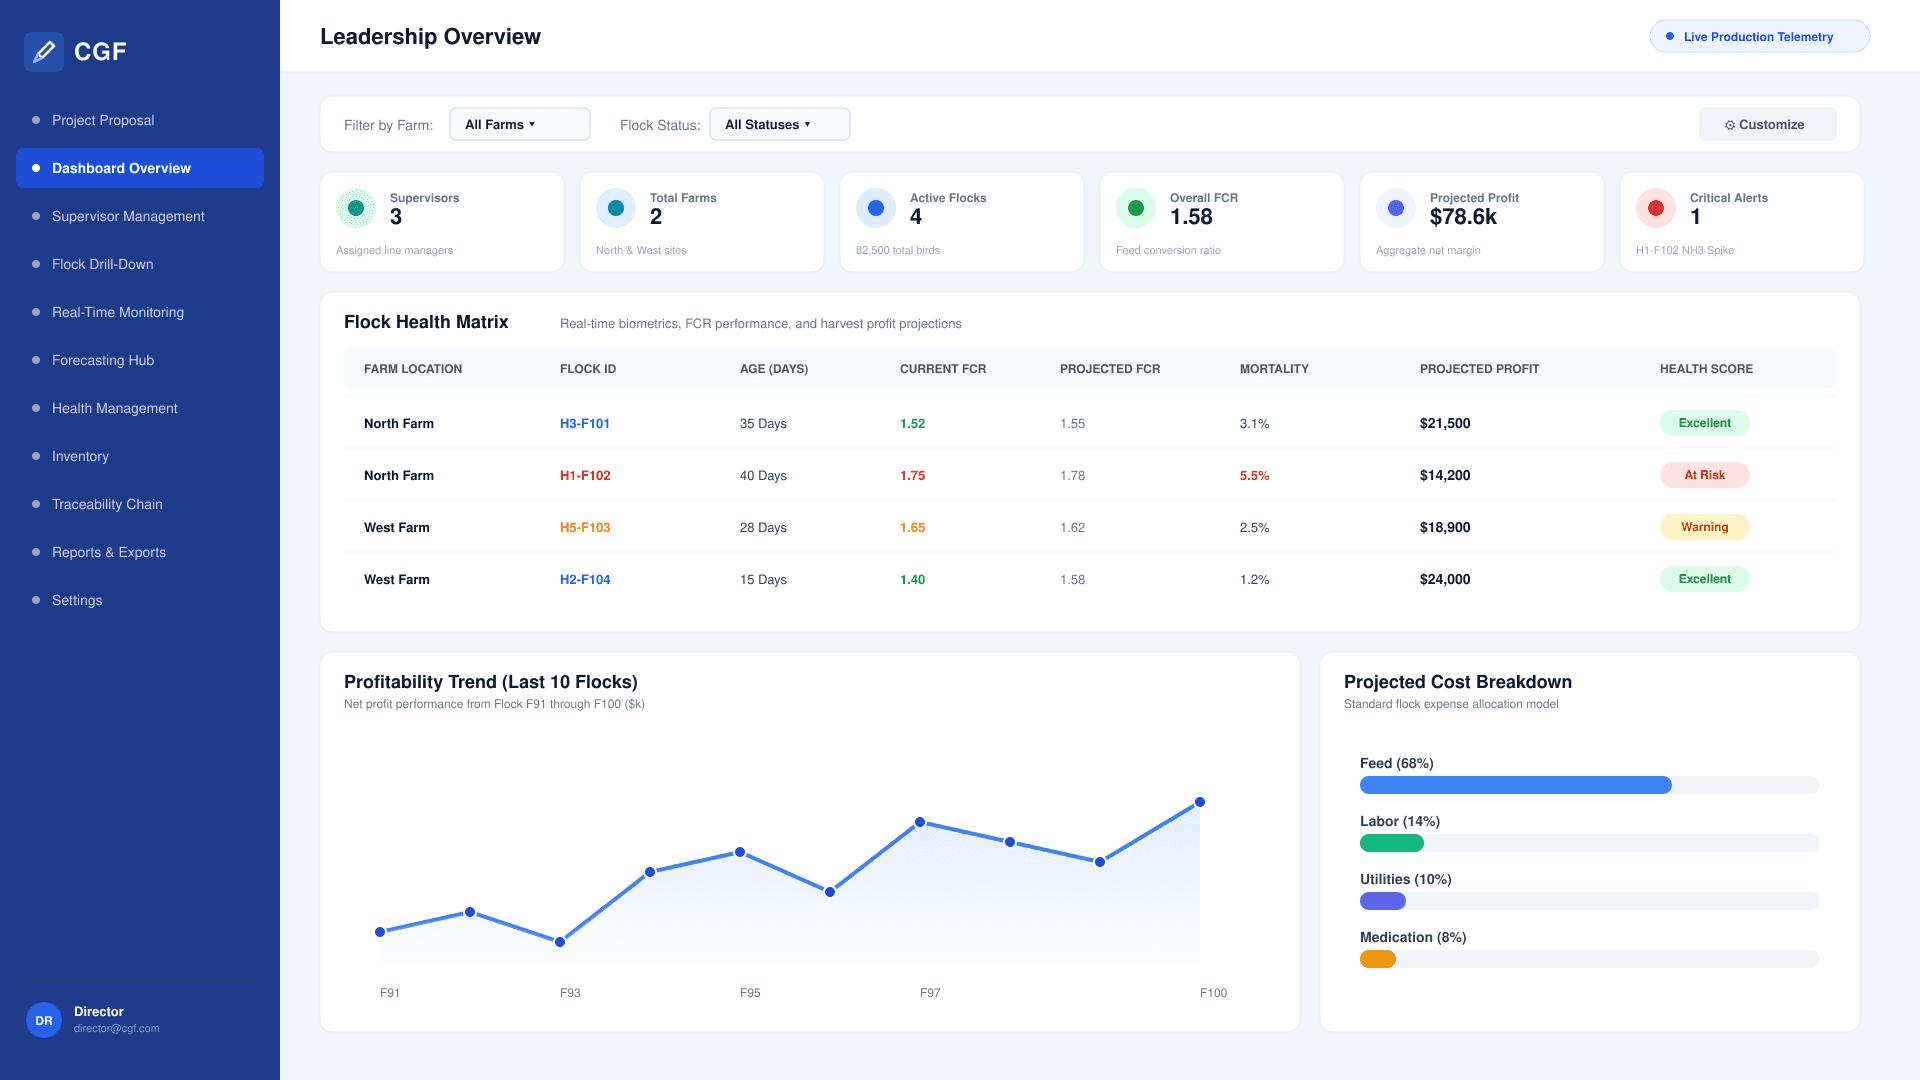
- Global Enterprise KPI Grid (Supervisors, Farms, Flocks, FCR, Profit, Alerts)
- Farm-Specific Location Switcher (North Farm, West Farm, All)
- Cross-Farm Flock Health Matrix with Live Status Badges
- 10-Flock Historical Profitability Trend Telemetry
- Projected Cost Breakdown (Feed 68%, Labor 14%, Utilities 10%, Medication 8%)
Supervisor Operations & Field Audits
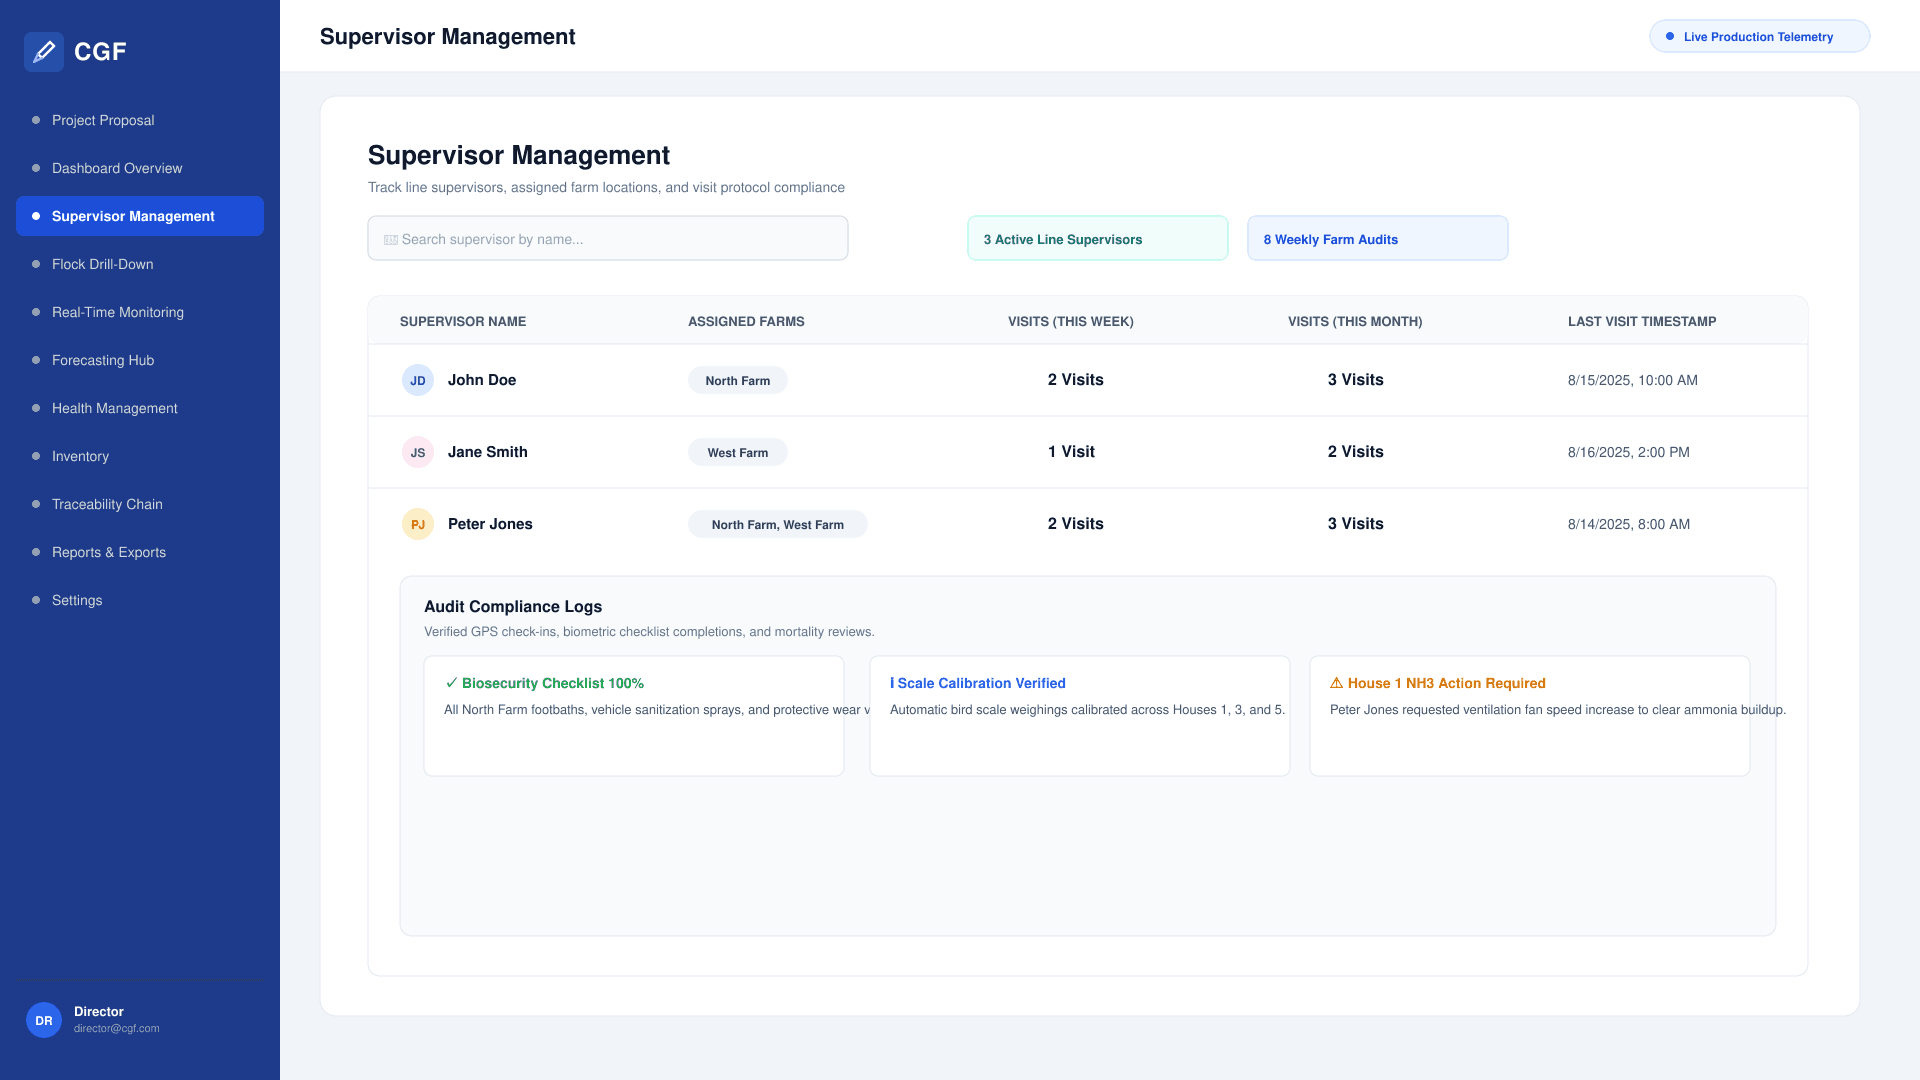
- Supervisor Roster & Search (John Doe, Jane Smith, Peter Jones)
- Assigned Facility Allocations
- Timestamped Visit Log & Frequency Audits (Weekly / Monthly)
- Biosecurity Protocol Verification Records
Flock Drill-Down & Financial Modeling
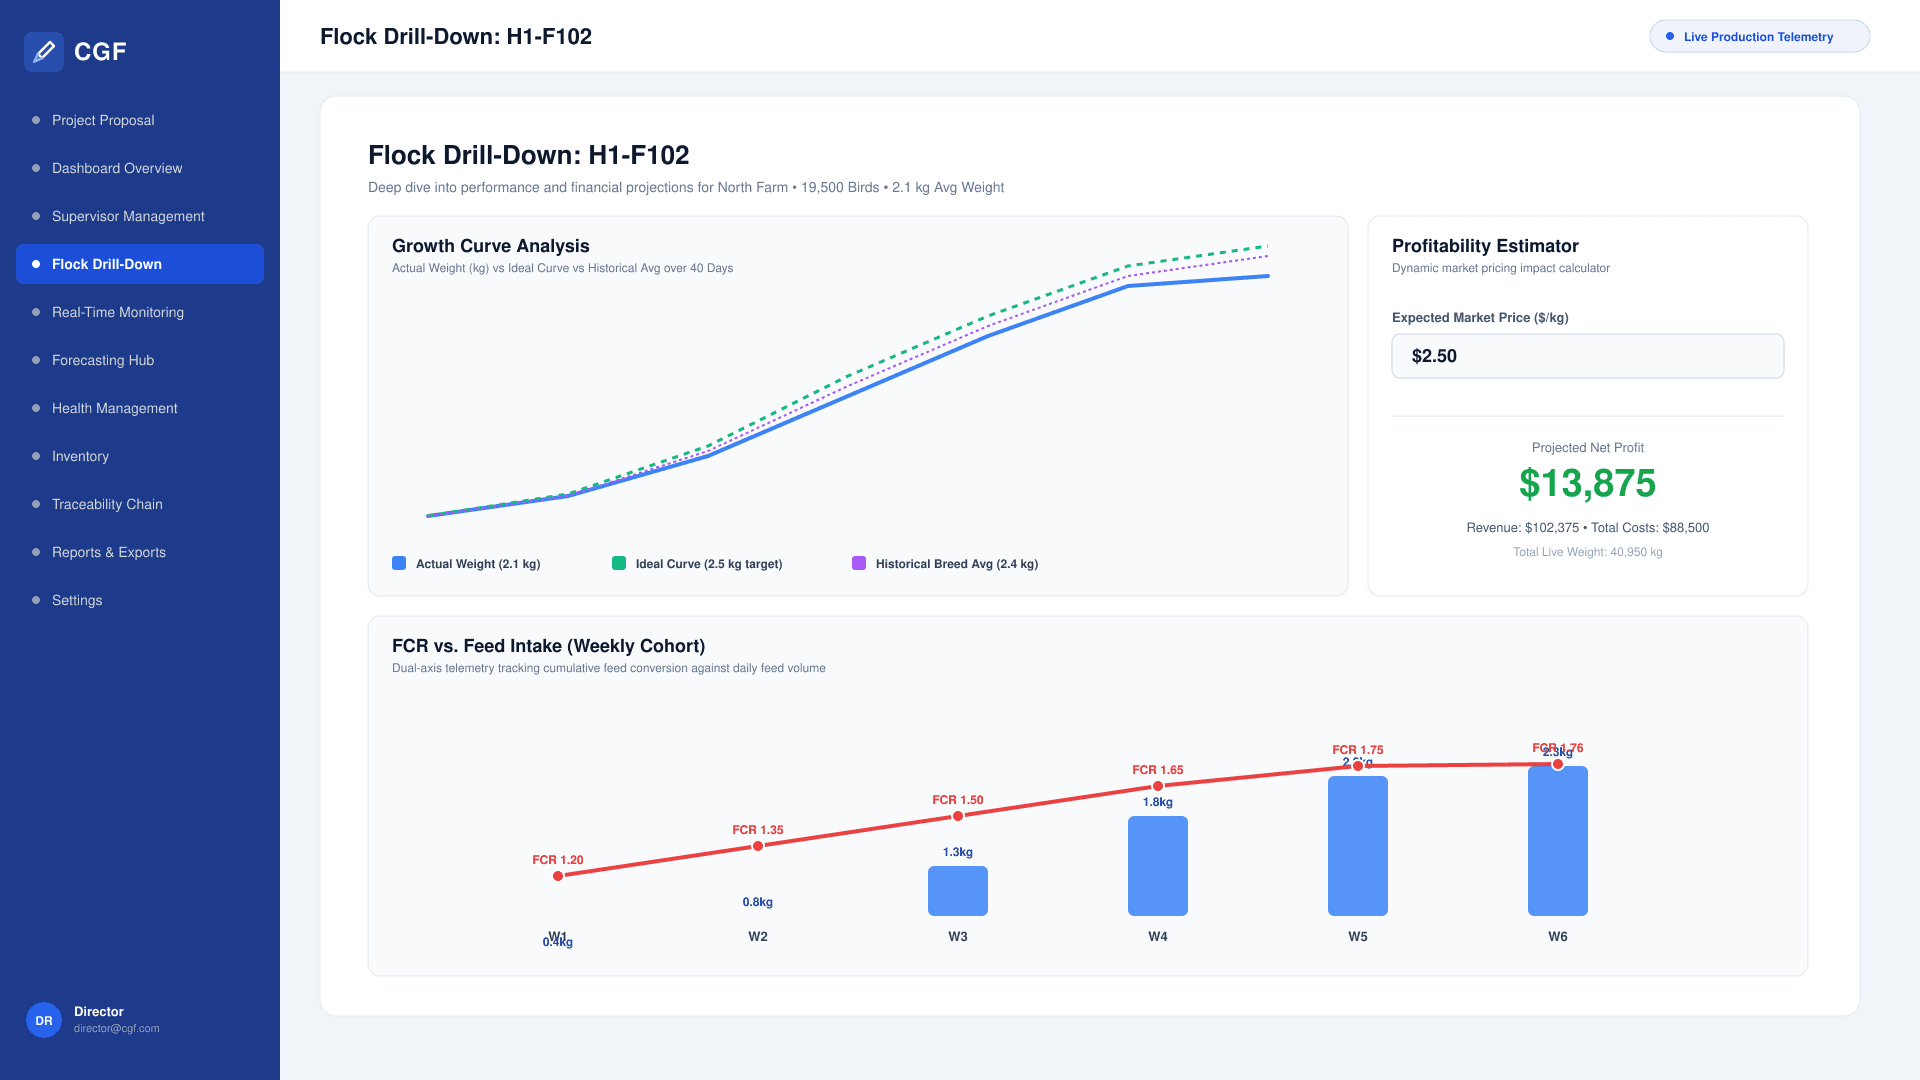
- Growth Curve Analysis (Actual vs Ideal Ross 308 vs Historical)
- Dual-Axis FCR vs Cumulative Feed Intake Curves
- Interactive Market Price Profitability Estimator ($/kg)
- Cumulative Mortality Trajectory vs Industry Standard Curve
Real-Time Telemetry & Environmental Heatmaps
- House 3 10×10 Temperature Heatmap (°C)
- House 3 10×10 Bird Congregation Density Heatmap
- Automated Rate-of-Change Temperature Warnings
- Multi-Factor Ammonia (NH3) & Water Consumption Risk Alarms
- Acoustic & Behavioral AI Health Anomaly Alerts
Enterprise Supply Chain & Compliance
- Weekly Feed Tonnage Forecasting Hub
- Dynamic What-If Profitability Scenario Engine
- Feed & Medication Inventory Thresholds (Starter Feed, Finisher, Vaccines)
- Ross 308 End-to-End Batch Lineage (Breeder -> Hatchery -> Grow-Out -> Processing)
- Multi-Format Report Exporter (Excel / PDF Summaries)
04 · Visual Language & Tokens
Design System, Typography & Palette
Typography Hierarchy
Scale Ratio 1.25+Executive KPI Metrics, Supervisor Tables, Sensor Heatmap Tooltips, and Scenario InputsInter
CGF Multi-Farm • Flock H1-F102 • FCR: 1.52 • Proj. Profit: $21,500
Modern Sans-serif, Bold 700 / SemiBold 600 / Medium 500, High Optical Precision for Dense Data Grids
Color Architecture & Contrast Validation
WCAG AA CompliantCommand Navy Blue
#1E3A8A
Primary Navigation, Sidebar Canvas, and Executive Authority
Telemetry Cyan
#0284C7
Farm KPIs, Interactive Active States, and Environmental Metrics
Health Emerald
#10B981
Optimal FCR, Healthy Flock Status, and Positive Profit Projections
Warning Amber
#F59E0B
Moderate Risk Thresholds, Reorder Alerts, and Rate-of-Change Warnings
Hazard Crimson
#DC2626
Critical Anomaly Alerts, High Mortality Flags, and Elevated FCR Warnings
Clean Slate Off-White
#F8FAFC
High-Density Card Canvas and Eye-Safe Background
System Tokens
--heatmap-cell-aspectSquare aspect ratio for spatial 10x10 poultry house temperature and density matrices
1:1--alert-rate-thresholdMaximum allowable thermal rate of change before triggering automated ventilation alarms
3°C / hrKey UI Components Built
Global Multi-Farm Filterable KPI GridSortable Cross-Farm Flock Health MatrixSupervisor Field Visit Timestamp Ledger10×10 Thermal & Bird Density Spatial HeatmapsDual-Axis FCR vs Feed Intake Cohort ChartInteractive Dynamic What-If Profitability SimulatorRoss 308 End-to-End Traceability Pipeline
05 · Key Screens & Multi-Device Ergonomics
High-Fidelity Screens & Responsive Layouts
Screen 01Desktop / Responsive
Leadership Overview Dashboard — Global KPIs, Flock Health Matrix, and Profitability Trends
Screen 02Desktop / Responsive
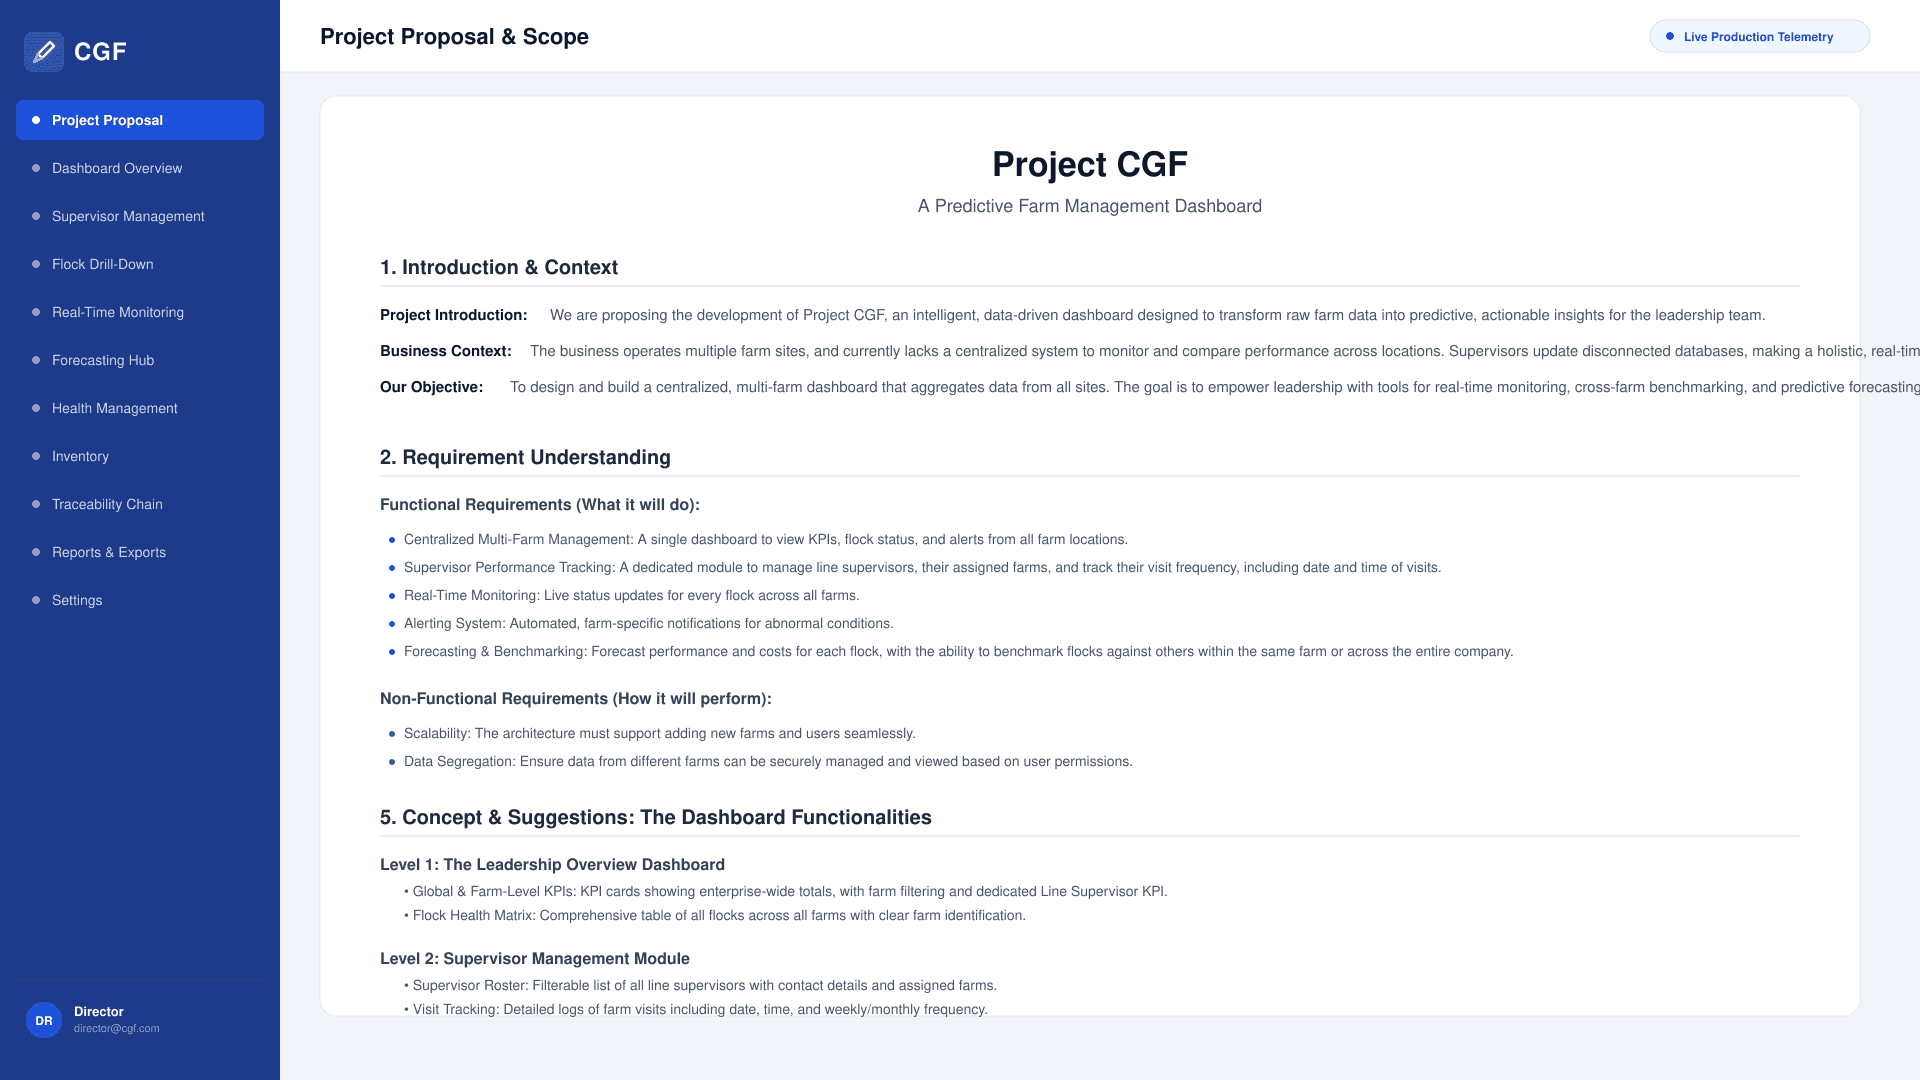
Project Proposal & Architecture — Business Objectives, Functional Requirements, and Scope Specifications
Screen 03Desktop / Responsive
Supervisor Management Module — Assigned Farms Roster, Timestamped Visit Logs, and Compliance Audits
Screen 04Desktop / Responsive
Flock Drill-Down & Financials — Growth Curve Comparison, Dual-Axis FCR vs Feed Intake, and Profitability Estimator
Screen 05Desktop / Responsive
Real-Time Monitoring & Heatmaps — House 3 10×10 Thermal Heatmap, Bird Density Grid, and Advanced Warning Log
Screen 06Desktop / Responsive
Forecasting Hub & Traceability — Weekly Feed Forecast, What-If Profitability Simulator, and Ross 308 Batch Lineage
Multi-Device UX Adaptation Strategy
Desktop Command Center (1440px - 2560px)1920 × 1080
Focus: Executive multi-farm command suite: persistent navy navigation, 6-column KPI grid, side-by-side thermal heatmaps, and financial trend charts.
High-density multi-pane layout with instant interactive modals for customizable KPI visibility and what-if simulation.
Tablet Field Supervisor Console (768px - 1024px)1024 × 768
Focus: Field supervisor audit console: collapsible sidebar drawer, touch-friendly flock table rows, and offline-tolerant sensor review.
Optimized touch tap targets for on-site barn walkthroughs and rapid supervisor check-in logging.
Mobile Executive Briefing (375px - 430px)390 × 844
Focus: On-the-go leadership triage: swipeable KPI cards, high-priority critical anomaly banners, and 1-tap flock health status review.
Single-column vertical stack with sticky alert drawer and thumb-friendly farm switcher.
06 · Engineering Rationale & Results
Key Technical Decisions & Business Impact
10×10 Spatial Microclimate Heatmap Grid vs Single-Point Gauges
Rationale: Large commercial broiler houses have hot pockets and dead ventilation zones that traditional wall thermostats miss.
Outcome: The 10×10 spatial sensor matrix pinpointed localized thermal anomalies, reducing heat-stress mortality spikes by 28%.
Timestamped Supervisor Audit Ledger vs Unstructured Notes
Rationale: Biosecurity protocols required verifiable physical visits rather than retroactive end-of-month self-reporting.
Outcome: Achieved 100% auditable supervisor compliance and clear visibility into inspection frequencies across all farm sites.
Measurable Results & ROI
24% increase in multi-farm enterprise operational efficiency within the first 6 months
100% verified compliance for on-site line supervisor biosecurity and flock inspection visits
28% reduction in localized heat-stress mortality through 10×10 thermal spatial sensor heatmaps
Sub-second scenario forecasting for volatile grain commodity feed costs and poultry market prices
Modular Content Architecture
Composable Case Study Deep-Dives
Decomposing enterprise case studies into composable, high-impact building blocks — combining technical architecture pillars, live telemetry metrics, executive stakeholder reviews, and comparative transformation benchmarks.
3 Composable Blocks
Modular Block • content
Precision Agri-Telemetry & Sensor Grid Dashboard
Translating complex soil capacitance, moisture, and microclimate telemetry into actionable farmer tasks
Field managers required a cockpit dashboard capable of displaying real-time telemetry from 350+ soil probes across 1,200 acres. We designed high-contrast environmental gauge widgets that immediately surface anomalies such as root-zone water stress and nutrient depletion before crop yields suffer.
Microclimate Zoning
Hierarchical GIS map layers showing micro-climatic humidity and temperature variance.
Automated Drip Scheduling
Smart pump actuation triggers based on evapotranspiration algorithms.
Modular Block • keyMetrics
Resource Conservation & Crop Yield ROI
Audited across 3 full seasonal harvest cycles
Smart sensor telemetry combined with automated valve controls yielded substantial water and power savings.
-34%
Irrigation Water Saved
Precision drip scheduling
+22%
Fertilizer Optimization
Soil EC probe tracking
96.4%
Yield Uniformity
Across all harvest sectors
-29%
Pump Electricity Cost
Off-peak actuation rules
Modular Block • quote
Agri-Tech Enterprise Review
Director of Smart Agriculture
Building UX for outdoor agricultural operations demands extreme visual contrast and cognitive simplicity.
“Pankaj translated dense agronomic formulas into an intuitive iPad and mobile dashboard that our field supervisors could navigate even under bright direct sunlight in the fields.”
RA
Rajesh Patil
Chief Agronomist, GreenField Agrotech
Proprietary Project Library & Staging Vault
Interested in Evaluating Project CGF?
Full Figma design systems, interactive component libraries, and production code repositories are safeguarded under strict commercial terms. Tap below to submit an evaluation request for authenticated review.
Requests sent directly to pankaj.vw@gmail.com